|
Strategies Analysis ToolThe purpose of this project is to develop a visualization tool of the multiple perspective analysis, Strategies Analysis Tool (SAT). Users can not only entry different points of view to explore strategies information, but make a more comprehensive management and communication. By using visualization and interactive operation, SAT enables users to figure out the strategies information and to make decision precisely. Otherwise, the clear and meaningful information help non-engineering professionals participate in decision-making.
|
|
ChallengesThe challenges for current river regulation meetings:
|
User Interface Design
In the user interface design phase, there were three main steps: purpose and user define, storyborad make, and paper prototype.
- Purpose and user defining
We first defined the purpose and user of the tool we wanted to develop through interviewing the experts. - Storyboard making
We then used storyboard to clarify the using situation for different users. - Paper prototyping
Paper prototyping could help us rapidly discuss with the real user and confirm if our design meet their expectations and needs.
|
Storyboard making
|
Paper prototyping
|
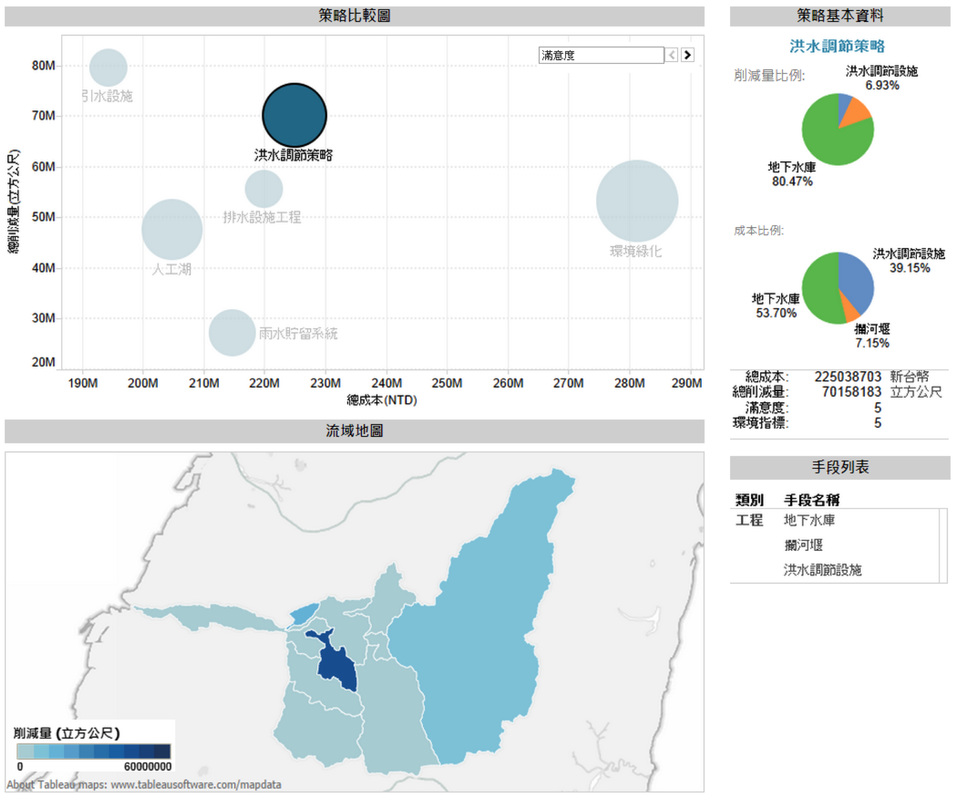
User Interface
|
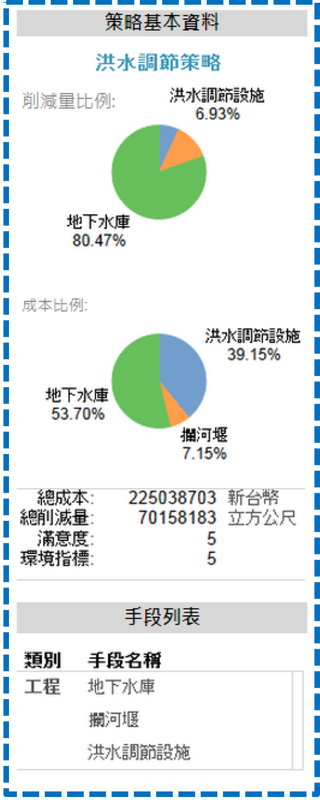
Strategies details
This part shows the details of the selected strategies.
|
Related Publications
C. W. Liu, W. C. Weng, C. H. Yang, J. C. Fu, S. Chiang and S. C. Kang (2013, Oct). Development of the Strategies Analysis Tool for Jhuo-Shuei River Regulations. 9th APRU Research Symposium on Multi-Hazards around the Pacific Rim, Taipei, Taiwan.
楊政玹、劉晉瑋、翁琬晴、傅金城、江申、康仕仲、蔡孟涵 (2013)。策略剖析工具─以濁水溪綜合流域治理為例。臺灣災害管理研討會,臺北,臺灣。
楊政玹、劉晉瑋、翁琬晴、傅金城、江申、康仕仲、蔡孟涵 (2013)。策略剖析工具─以濁水溪綜合流域治理為例。臺灣災害管理研討會,臺北,臺灣。
